MyOrbit
Full-Stack
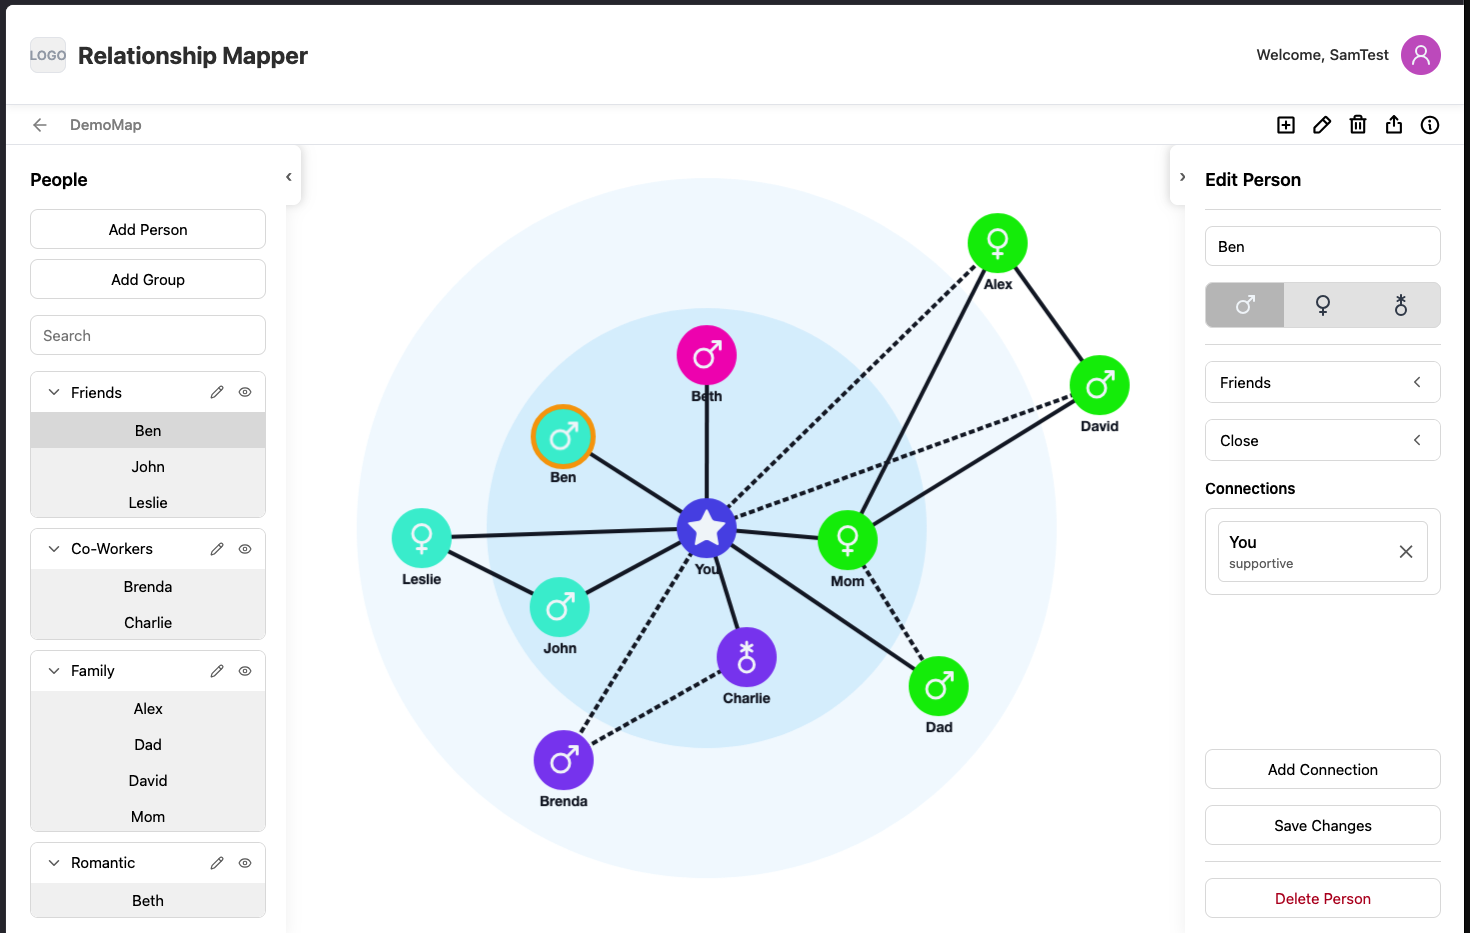
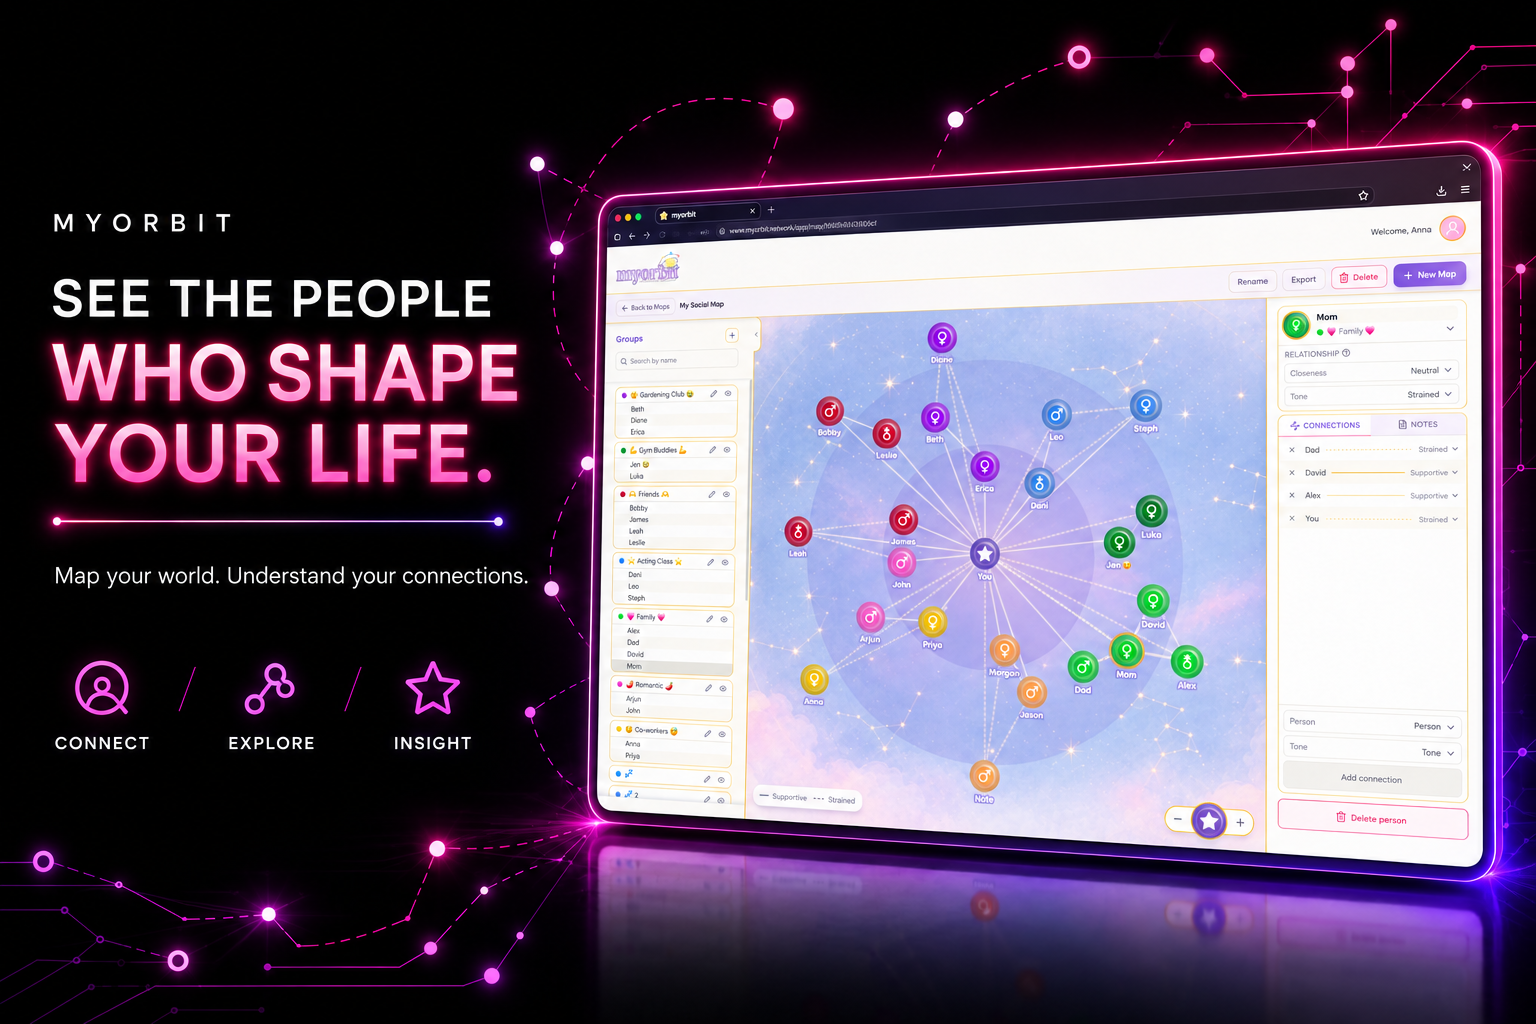
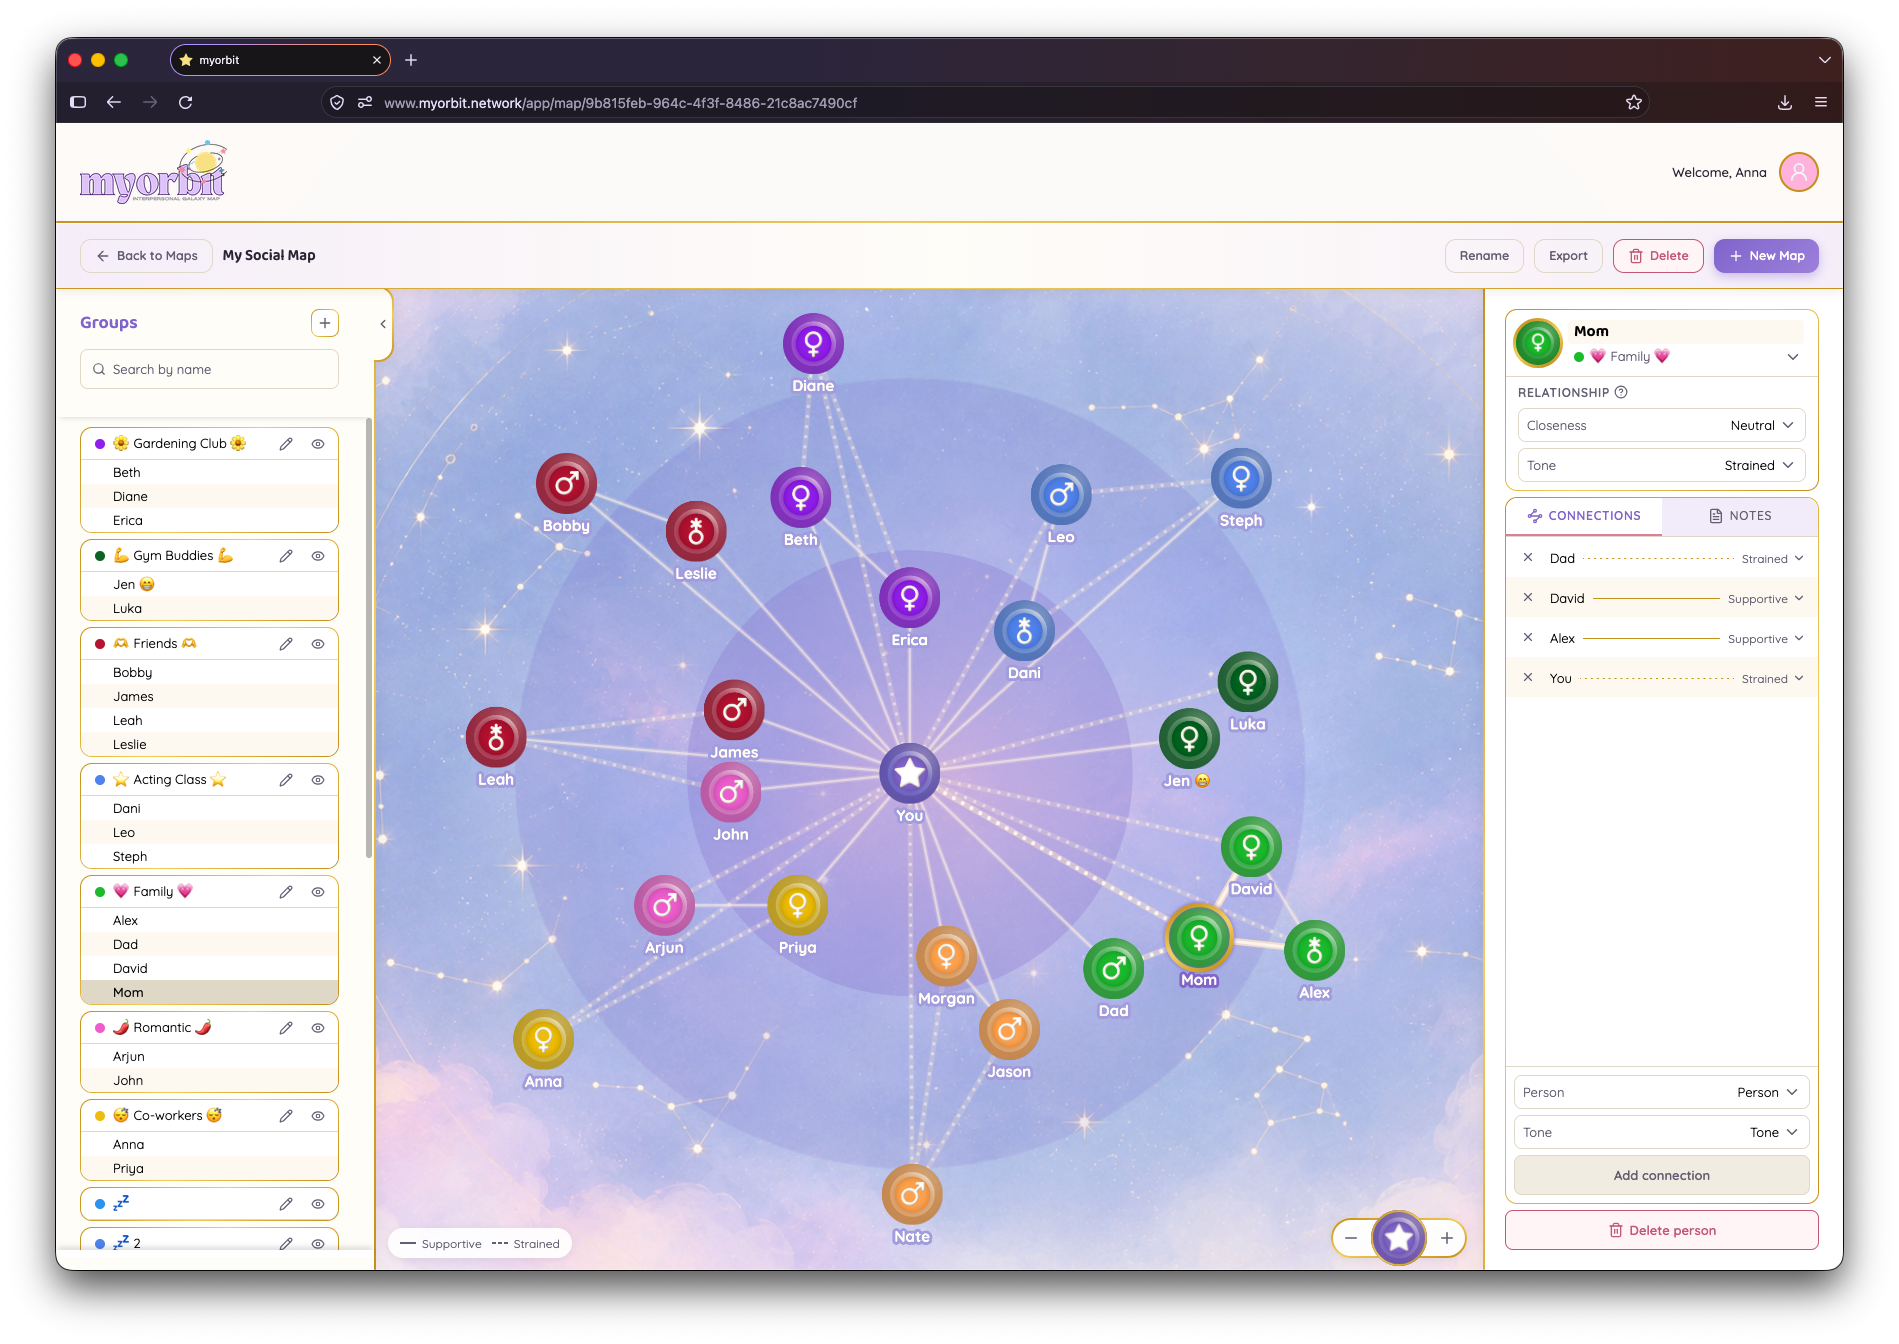
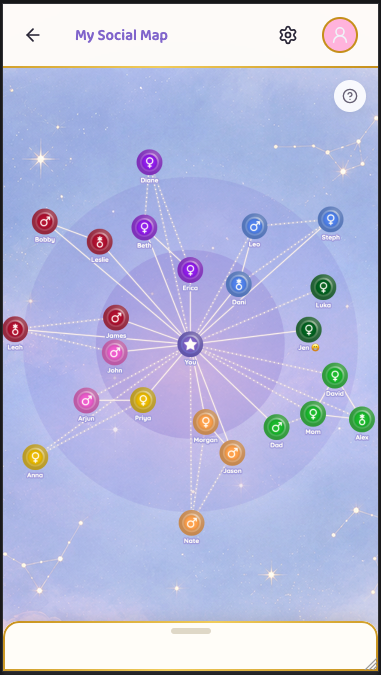
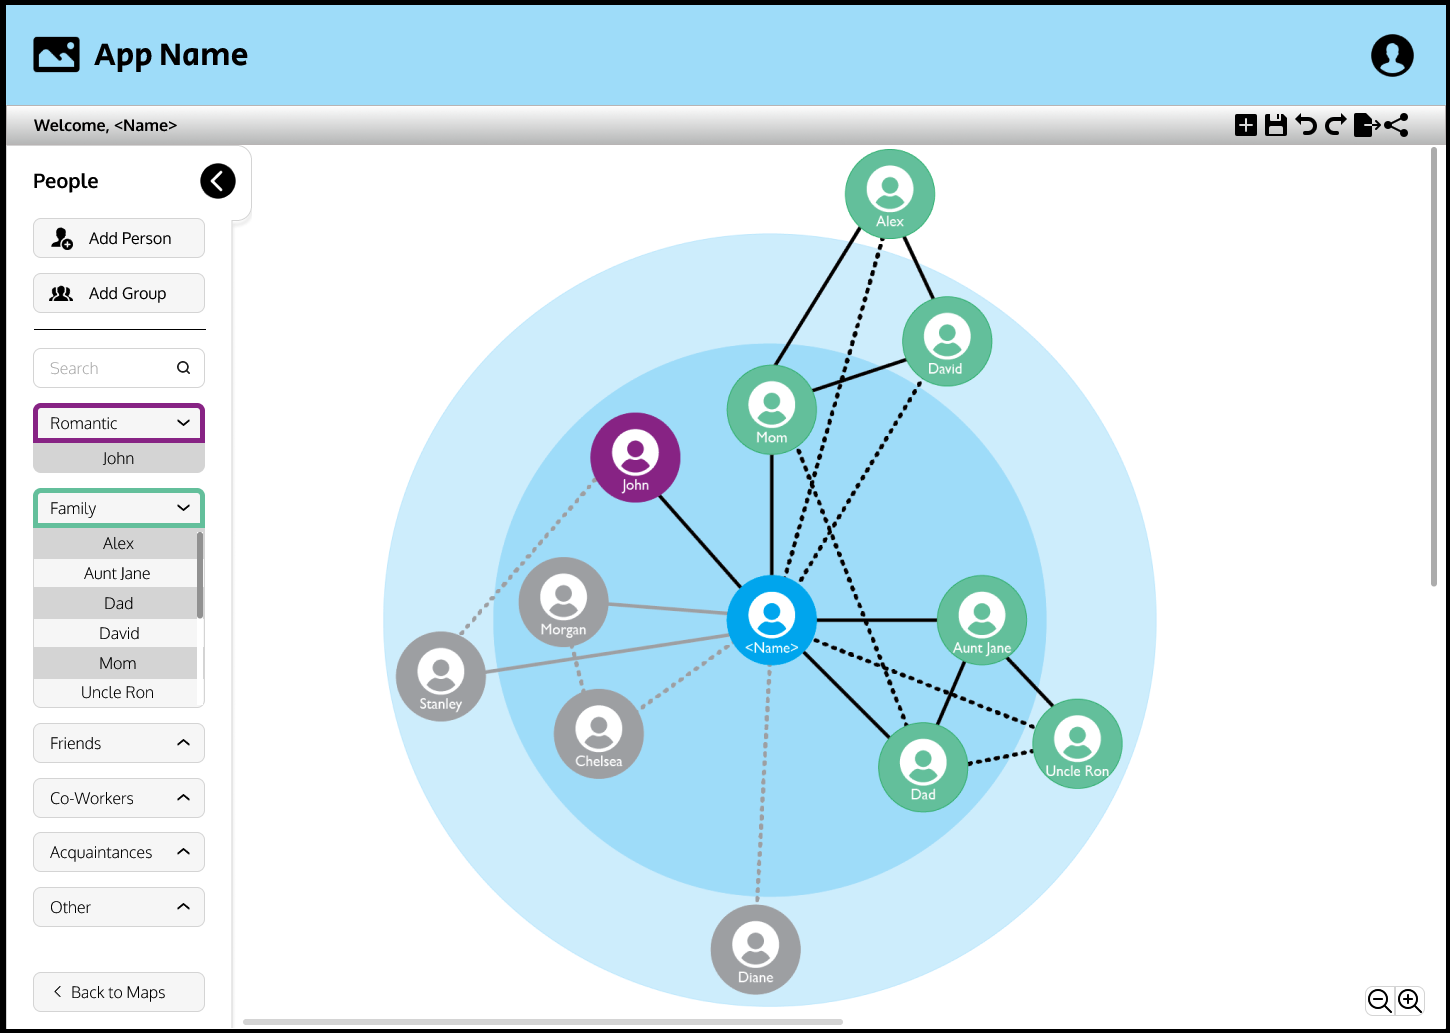
MyOrbit is a map of the people in your life. People are nodes, relationships are connections, and the map can show how everyone fits together instead of giving you another list of names to keep straight.
I was responsible for the design, frontend, backend, database, security, billing, testing, and deployment. I also had to figure out how to make the graph work on a phone without compromising usability.
Role
Solo full-stack engineer, contracted through Castle Logic LLC for EmmeCo. Designed, built and tested with an agentic engineering workflow I set up and ran.
Stack
What's distinctive here
Live product: myorbit.network
- A NETWORK, NOT A FAMILY TREE: people connect to one another, not just to the account holder. Real social circles have loops, overlapping groups, and relationships that do not fit neatly into a hierarchy.
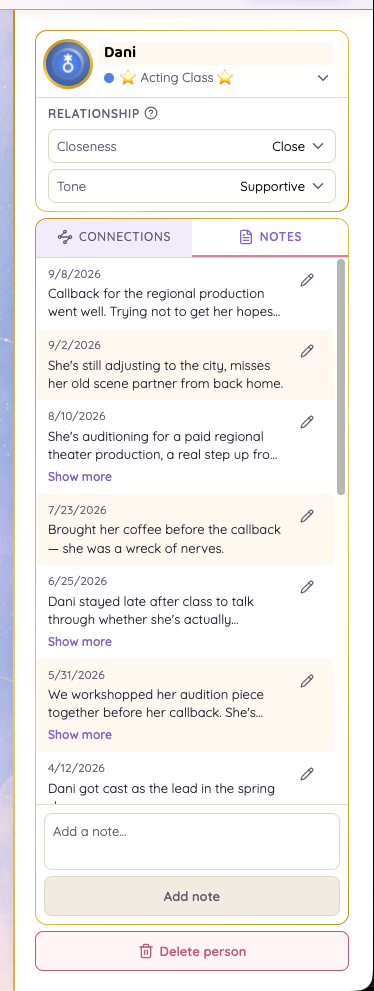
- CLOSENESS AND TONE ARE DIFFERENT: closeness describes how important someone is to you. Tone describes whether the connection feels supportive or strained. Those are not interchangeable.
- A PERSONAL TOOL, NOT A CLINICAL SYSTEM: the map can help people make sense of their support network, without accounts or shared access for therapists.
- PRIVATE BY DESIGN: every account owns its own data. Sharing happens when the user chooses to export a PDF, not by granting another person access to the account.
- BUILT WITH AN AGENT WORKFLOW: I was the only developer, but not the only set of hands writing code. I designed and ran a multi-agent workflow with scoped tasks, written decisions, project memory, reviews, and tests.
The idea
The idea was simple to explain: map the people in your life. It has a little of the family-tree feeling of Ancestry, but a tree is the wrong shape. Friends know family members, coworkers know friends, and relationships loop back around. A network can show those connections without pretending everyone's part of one tidy branch.
The client had already looked for a tool that did this. Genograms cover family relationships, while a lot of the other options are built for organizations and end up looking like org charts. The rest were too clunky for something people would need to keep up to date.
The first brief was a few requirements and a screenshot of a network diagram. I had to work out what the map meant, how people would edit it, what data needed to be stored, and how to make the whole thing usable enough that someone would come back to it.
Three details needed clear rules before I could build around them:
- Relationship types: friend, coworker, in-law, or a label the user creates.
- Closeness: the map should make a close relationship look different from an acquaintance.
- Simplicity: the user should not need to manage a complicated diagram just to keep it current.
What the map means
A visual map is only useful if its visual language stays consistent. I had to turn vague ideas like "show how close people are" into rules the application could apply every time.
- Closeness has a small set of levels. More levels sounded flexible, but they made the map harder to read and gave each placement less meaning.
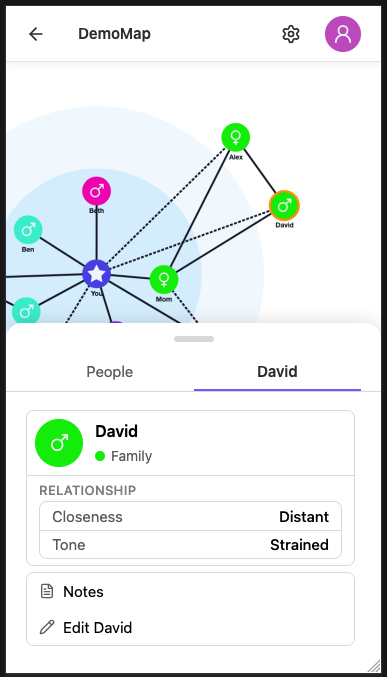
- Connection tone is separate. A person can be very close to you and still be part of a strained relationship. Tone can be supportive or strained without changing closeness.
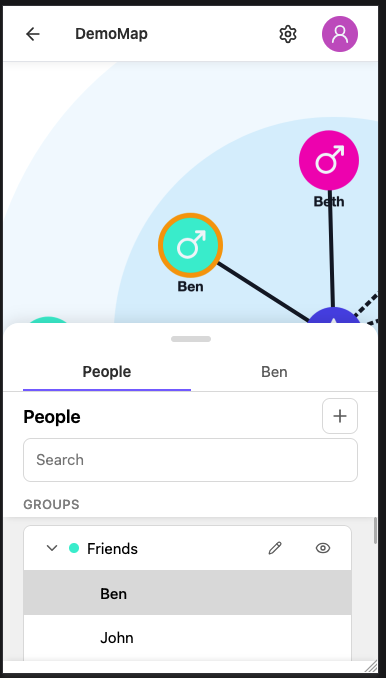
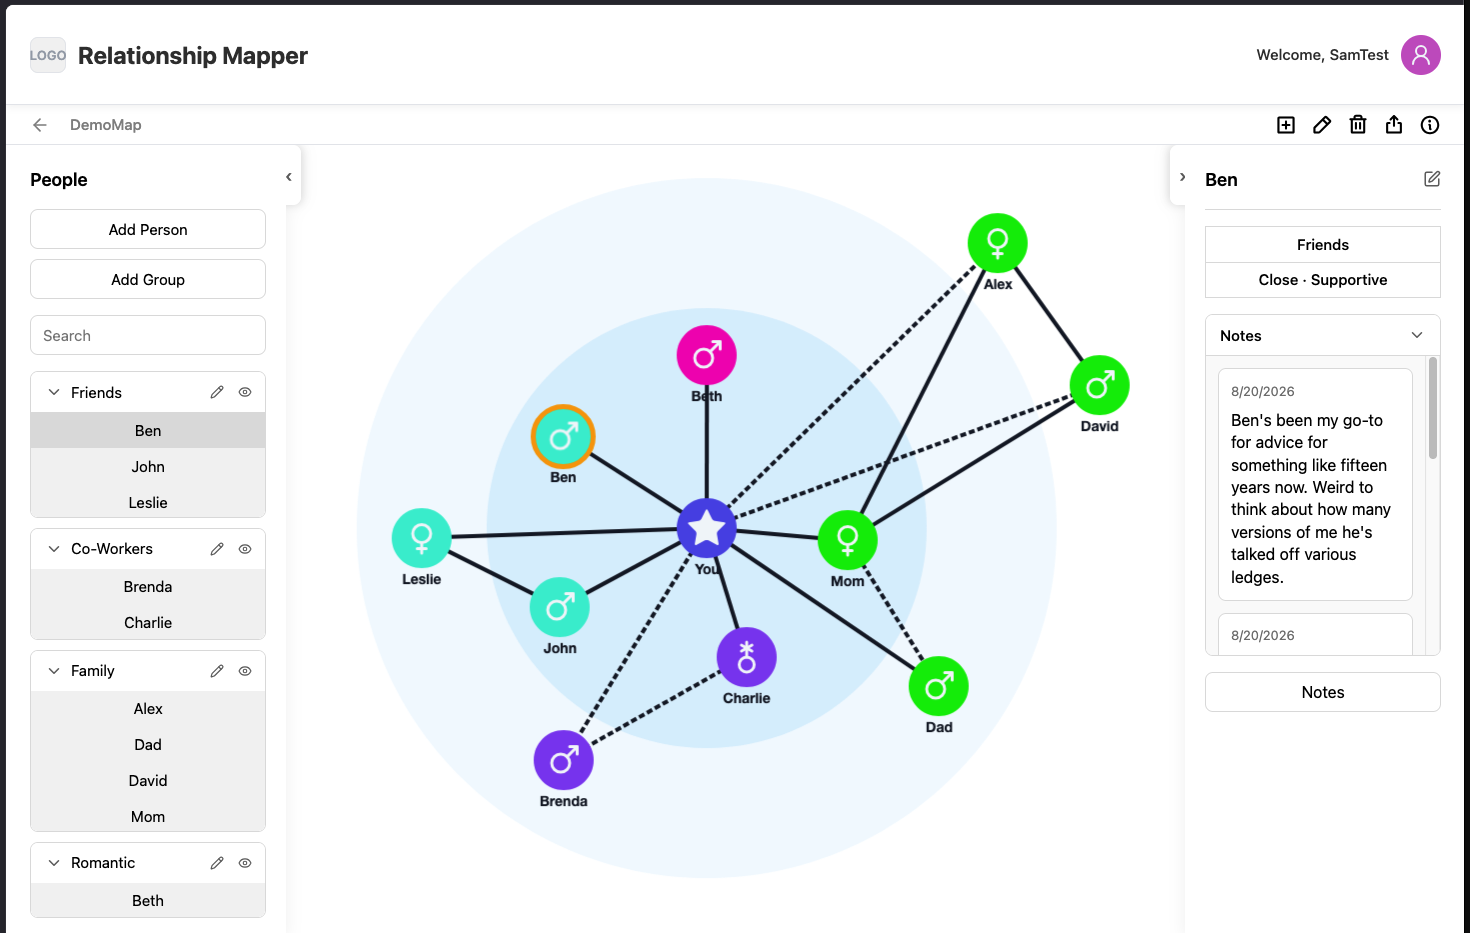
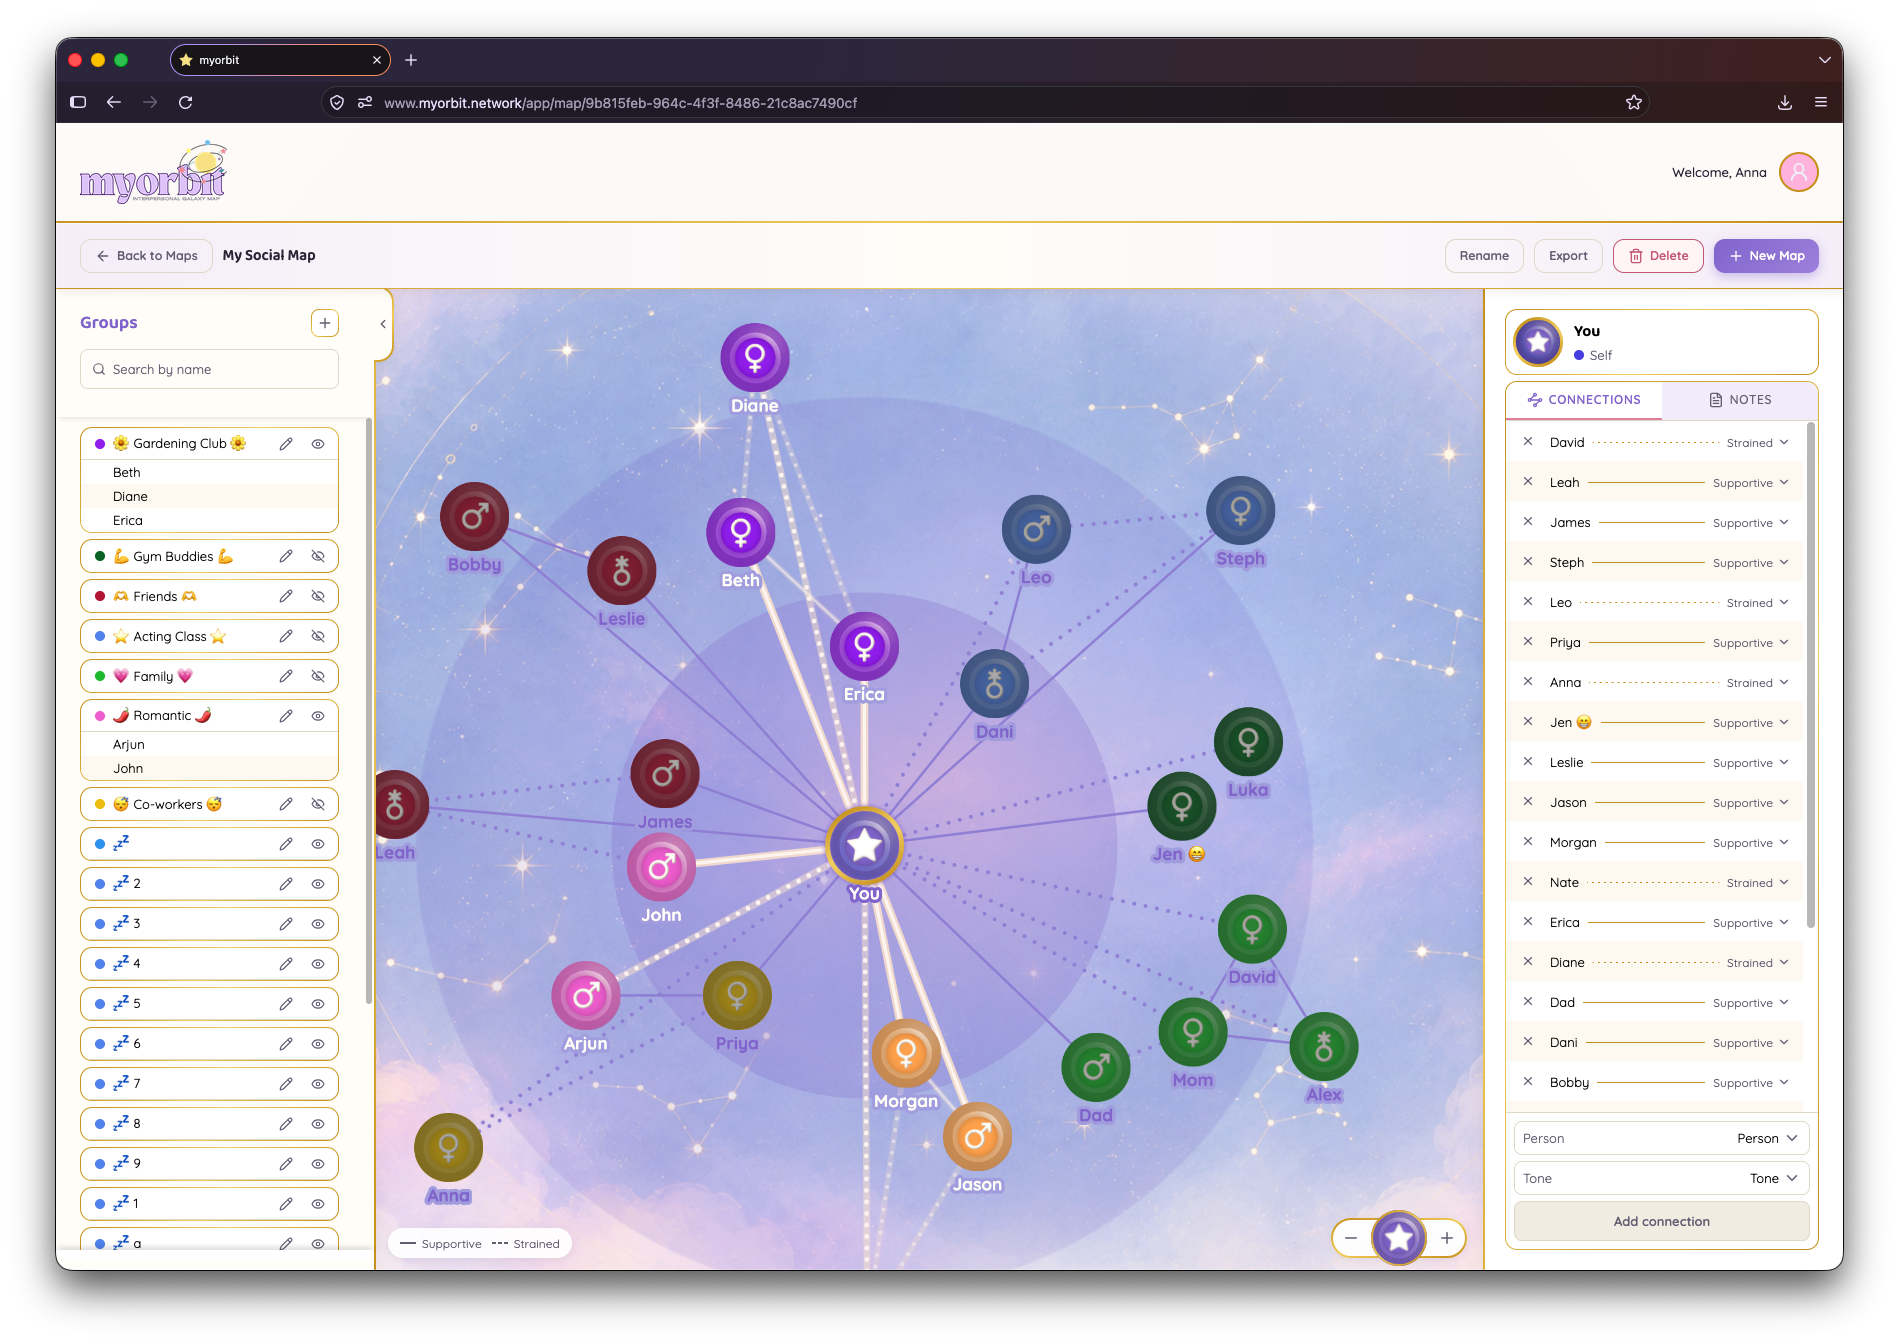
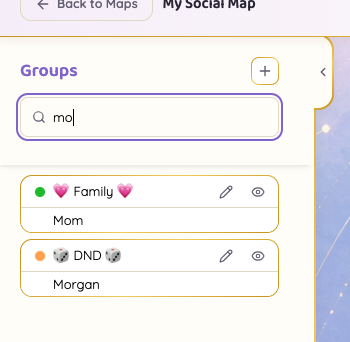
- Groups belong to the user. Someone can make groups such as Family, Work, or Book Club, choose their colors, and hide a group when they want to focus on the rest of the map.
- The user stays at the center. People are placed according to their closeness to the account holder, but connections can run between any two people.
When someone is added, the layout finds a spot at the appropriate distance and avoids overlapping the other nodes. That position is saved, so reopening the map does not rearrange everyone's world. Users can drag people around to organize the view, but dragging does not silently change the relationship data. If closeness changes, the user has to choose that explicitly.
From a rough brief to a live product
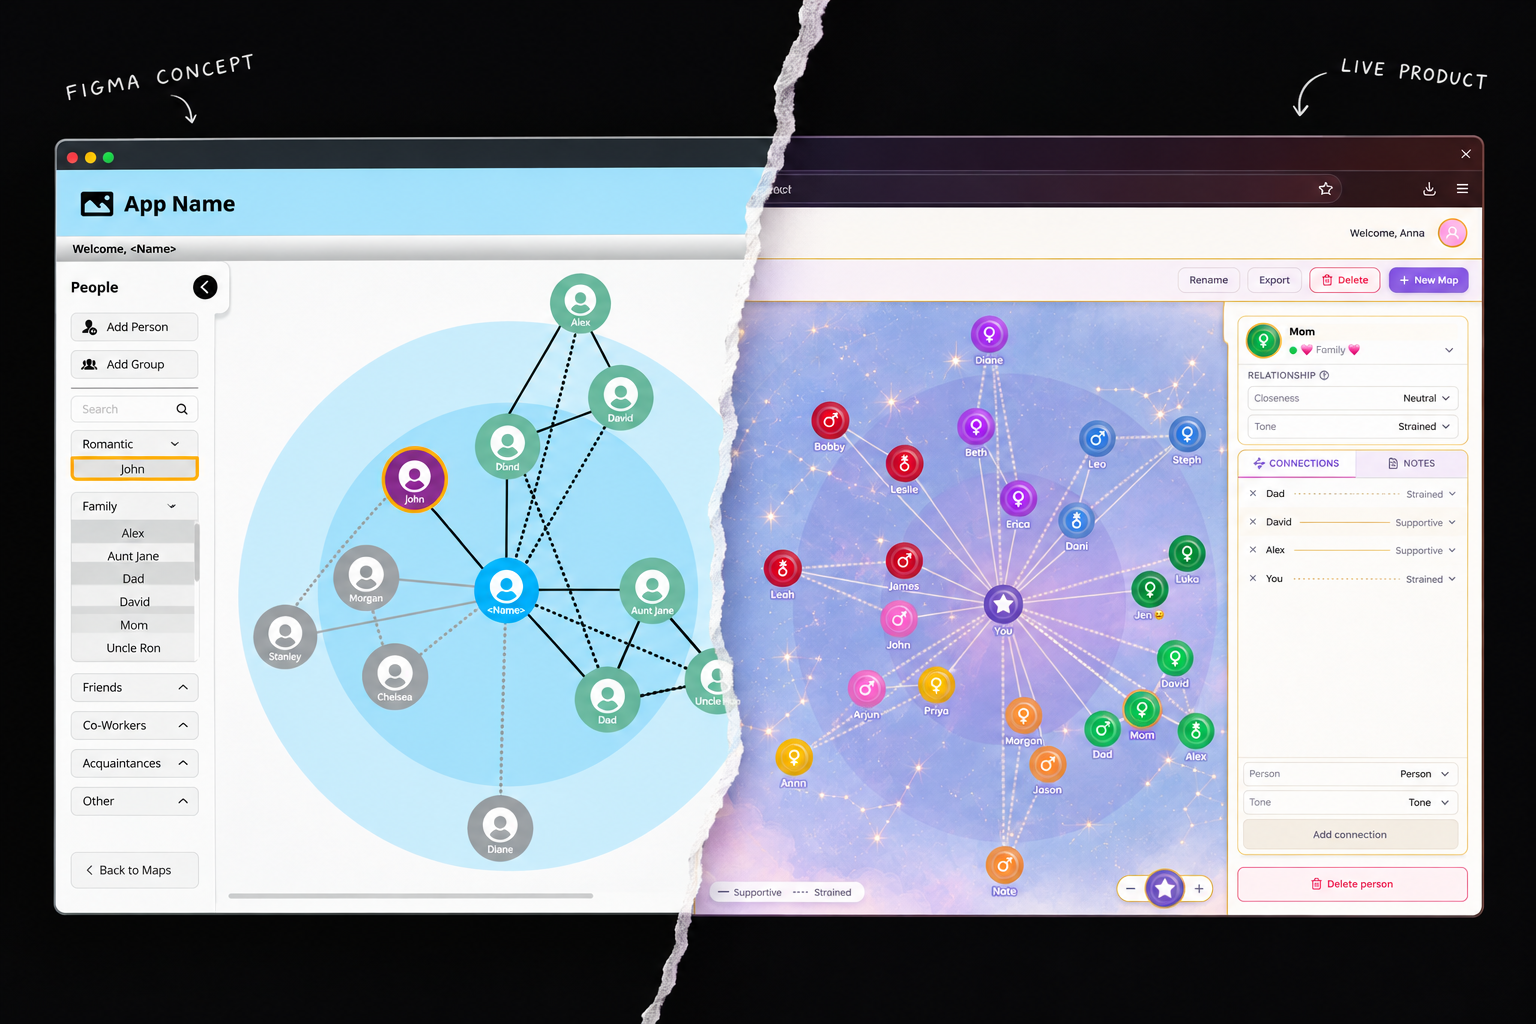
There was no full specification waiting for me. I worked through the decisions and implementation in stages, and owned the whole thing:
- Product rules: define people, groups, connections, and closeness levels, including what the map should and should not do.
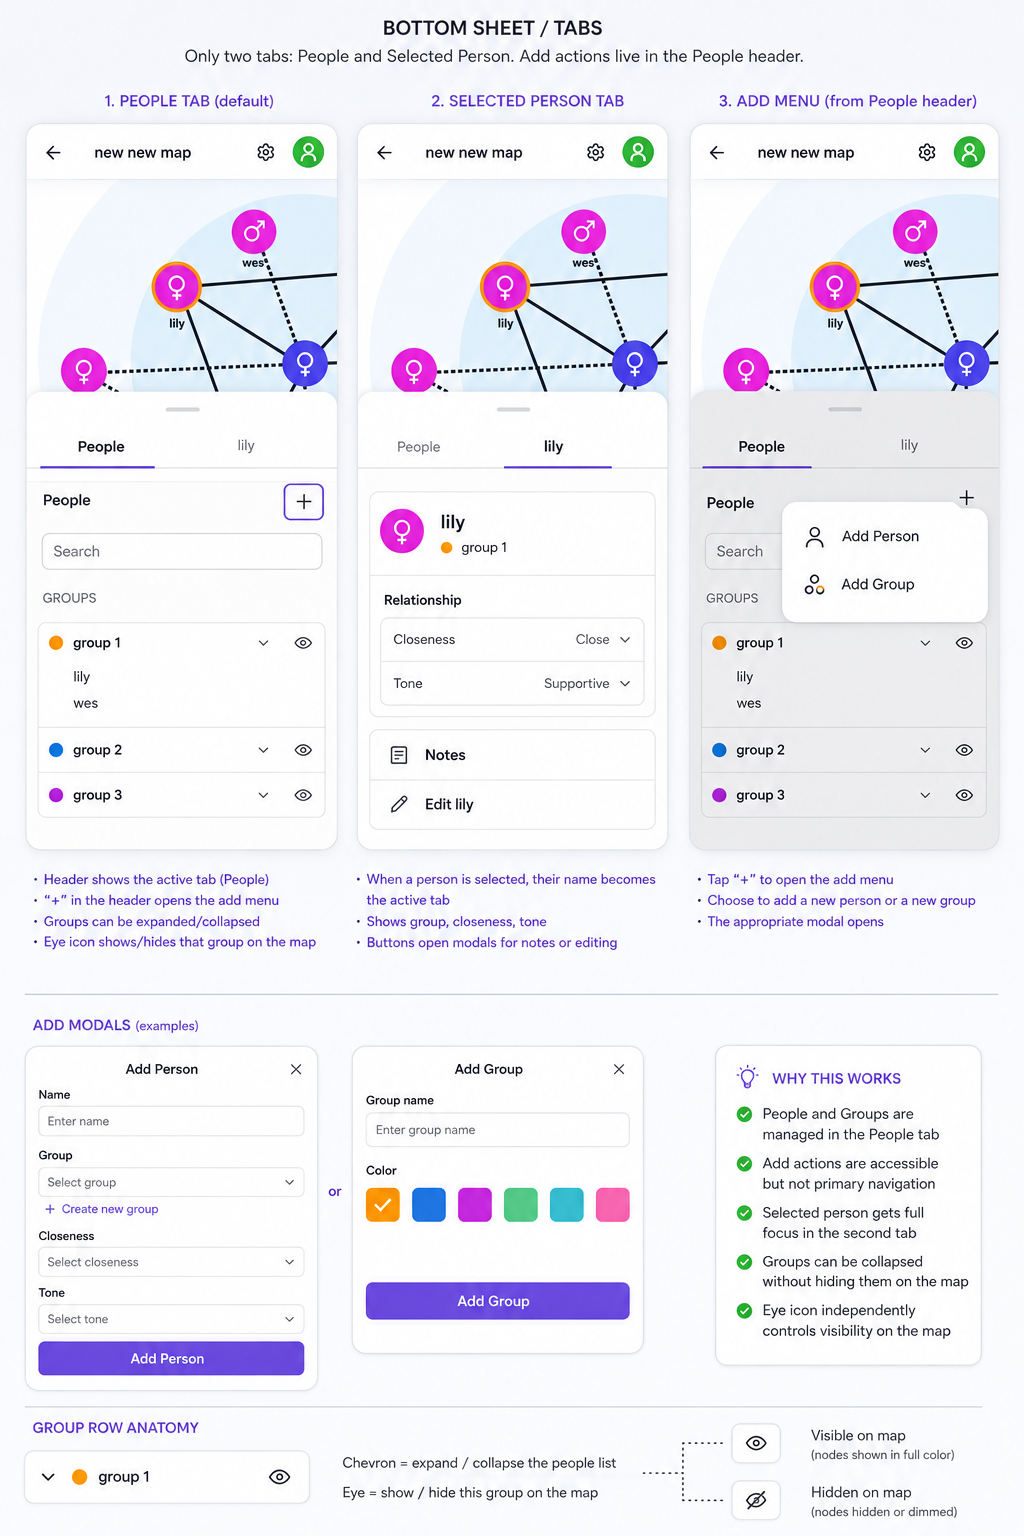
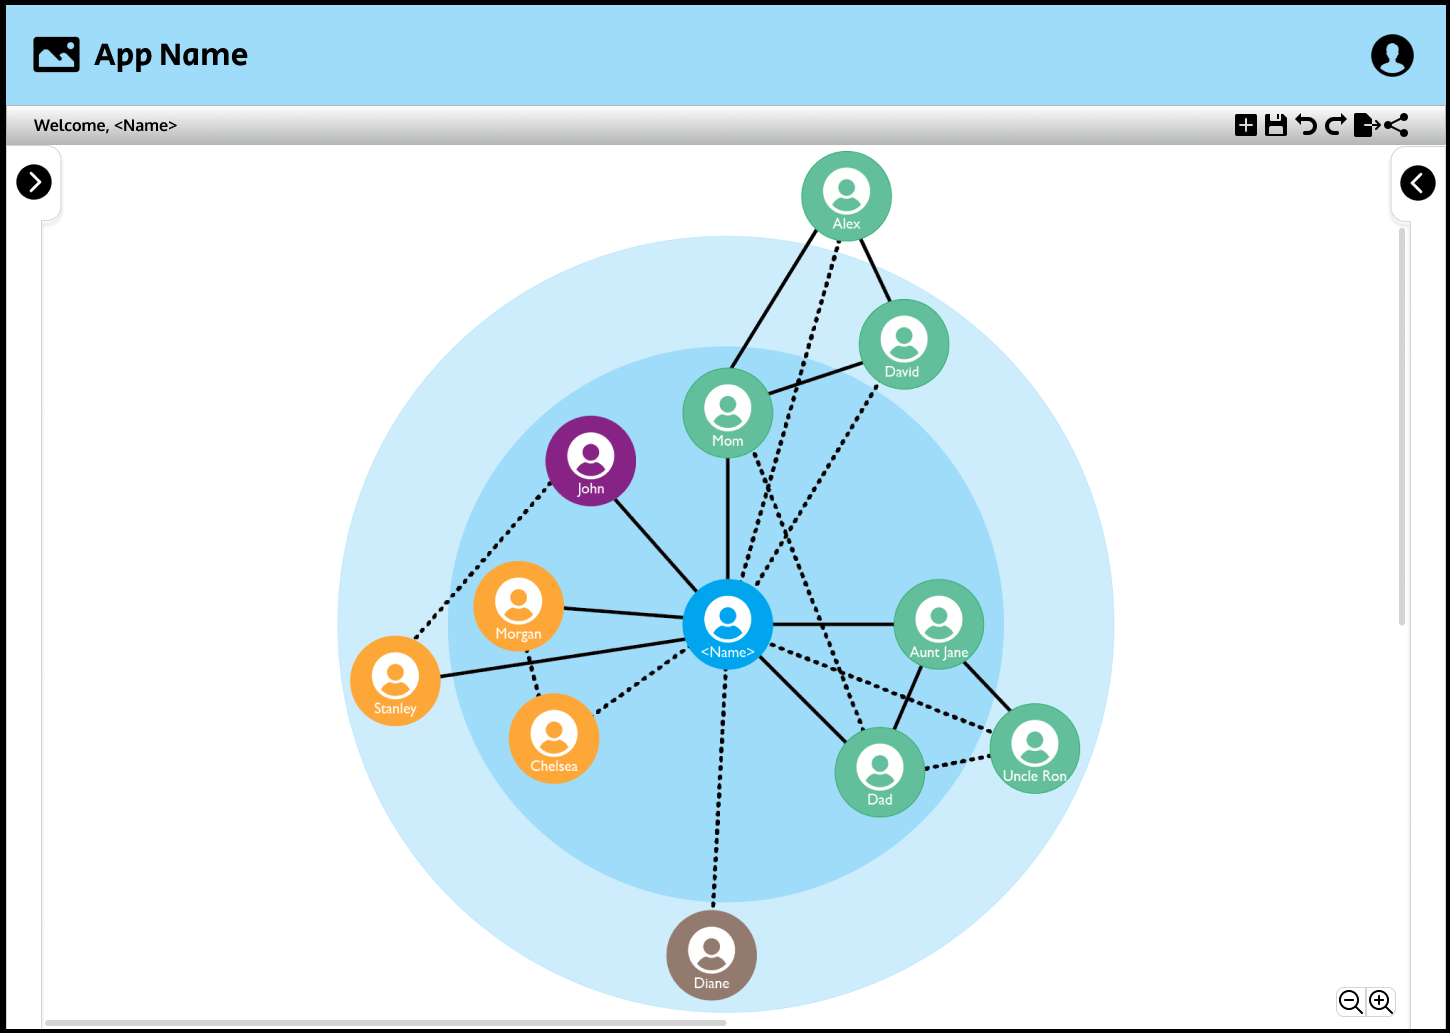
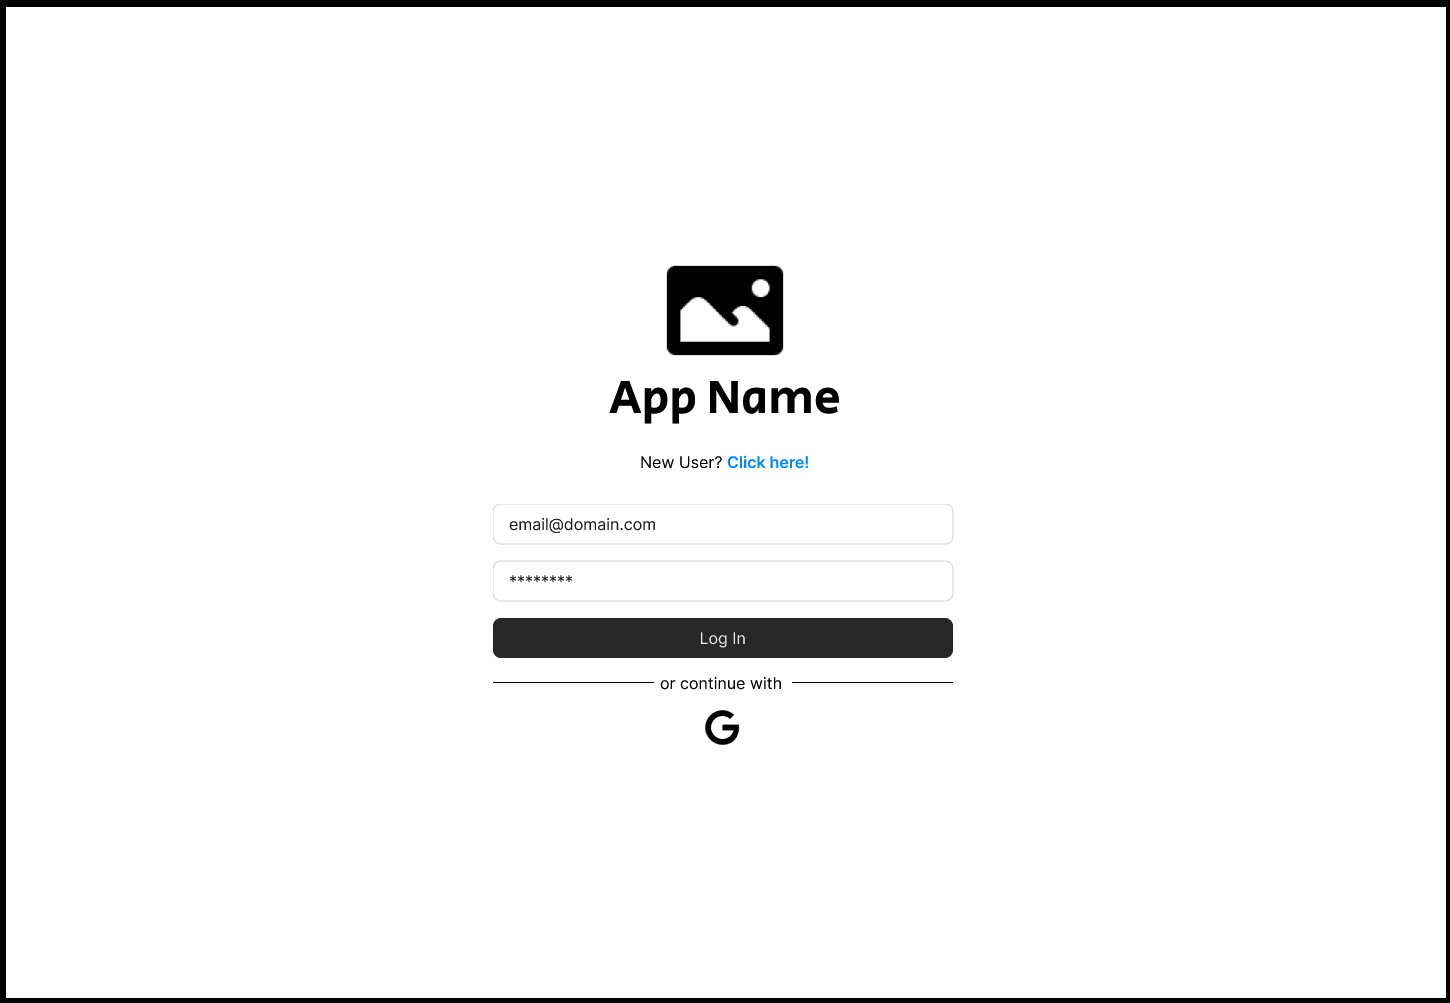
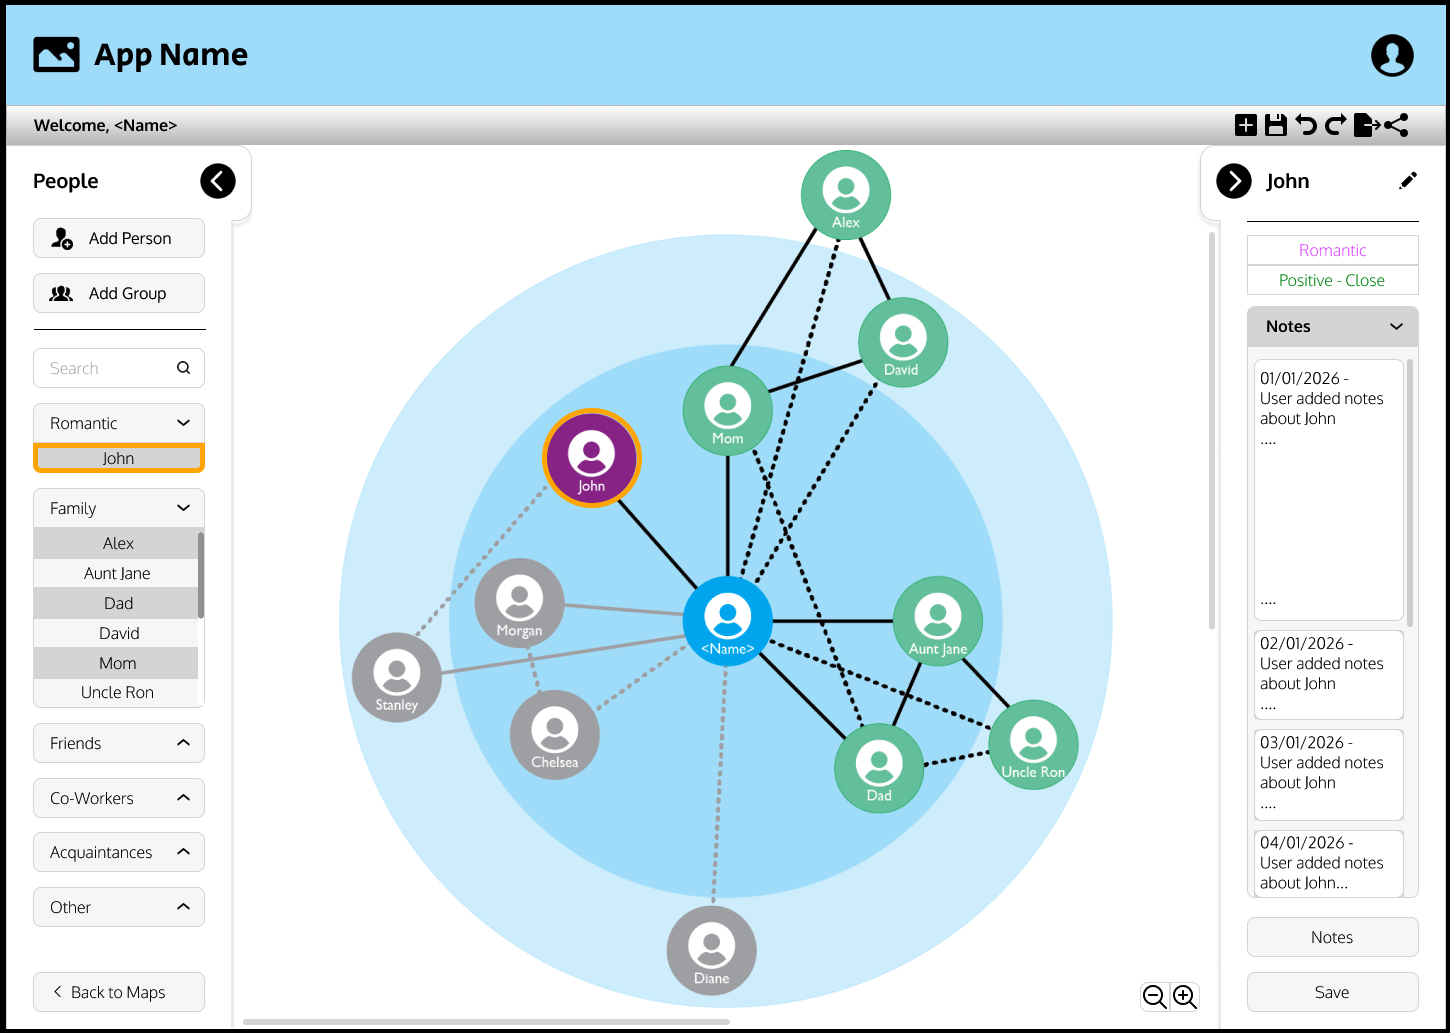
- Design: work through the graph, person details, groups, and sign-in screens in Figma before building them.
- Frontend: build the interactive graph, forms, people list, notes, and PDF export, then redesign the interface for phones.
- Backend: build the database schema, business logic, and account-level data protections.
- Accounts and billing: add sign-in, free and paid plans, group-sponsored access, and shared access codes.
- Testing: build three automated test suites and make them part of the deployment checks.
- Launch and handoff: set up email delivery, an in-app bug reporter, access codes, and documentation for the decisions the client needs to manage, including pricing.
How I ended up working with agents
This was my first agentic development project, so I changed the workflow as I learned where it was helping and where it was getting in the way.
At first, I asked ChatGPT for snippets one at a time. Each piece could look reasonable by itself, but it had no reliable view of decisions made in other files. I ended up stitching together code that used different names and patterns, then chasing the bugs that came from those mismatches.
Next I moved the coding to Claude and started keeping project notes in Markdown files. That helped, but I was still the one carrying context between sessions and making sure the notes made it into the next conversation.
Then I moved to Claude Code, which could inspect the repository instead of relying on whatever I remembered to paste in. It was a big improvement, and it also burned through usage quickly. That sent me down the rabbit hole of learning how people were organizing agentic work, not just asking a model to write code.
The workflow I use now has a planner that scopes and batches work, subagents that implement small tickets, and me reviewing the results and stepping in when needed. The roles are deliberate:
- Scaffold before implementation. Decide the structure, naming, and important behavior before agents start writing application code.
- Keep tickets small. Group work by the files it touches and review between batches. I also built a reusable skill that checks the running app, traces a problem back to the code, and turns it into tickets.
- The planner does not edit app files. Its job is to plan the work, not to quietly start implementing it. I caught that boundary slipping once and made the rule explicit.
- Write decisions down. The project now has around 70 memory entries, plus decision documents for client-specific choices. A new session should not have to guess why something was built a certain way.
- Use tests to check the work. Agents can explain why a change should work. The tests check whether it actually does.
One billing agent still implemented assumptions that contradicted decisions the client and I had already made in writing. The code was not the problem. The agent had started from the wrong context. Now related work has to read the decision documents before implementation.
The 27-migration bug
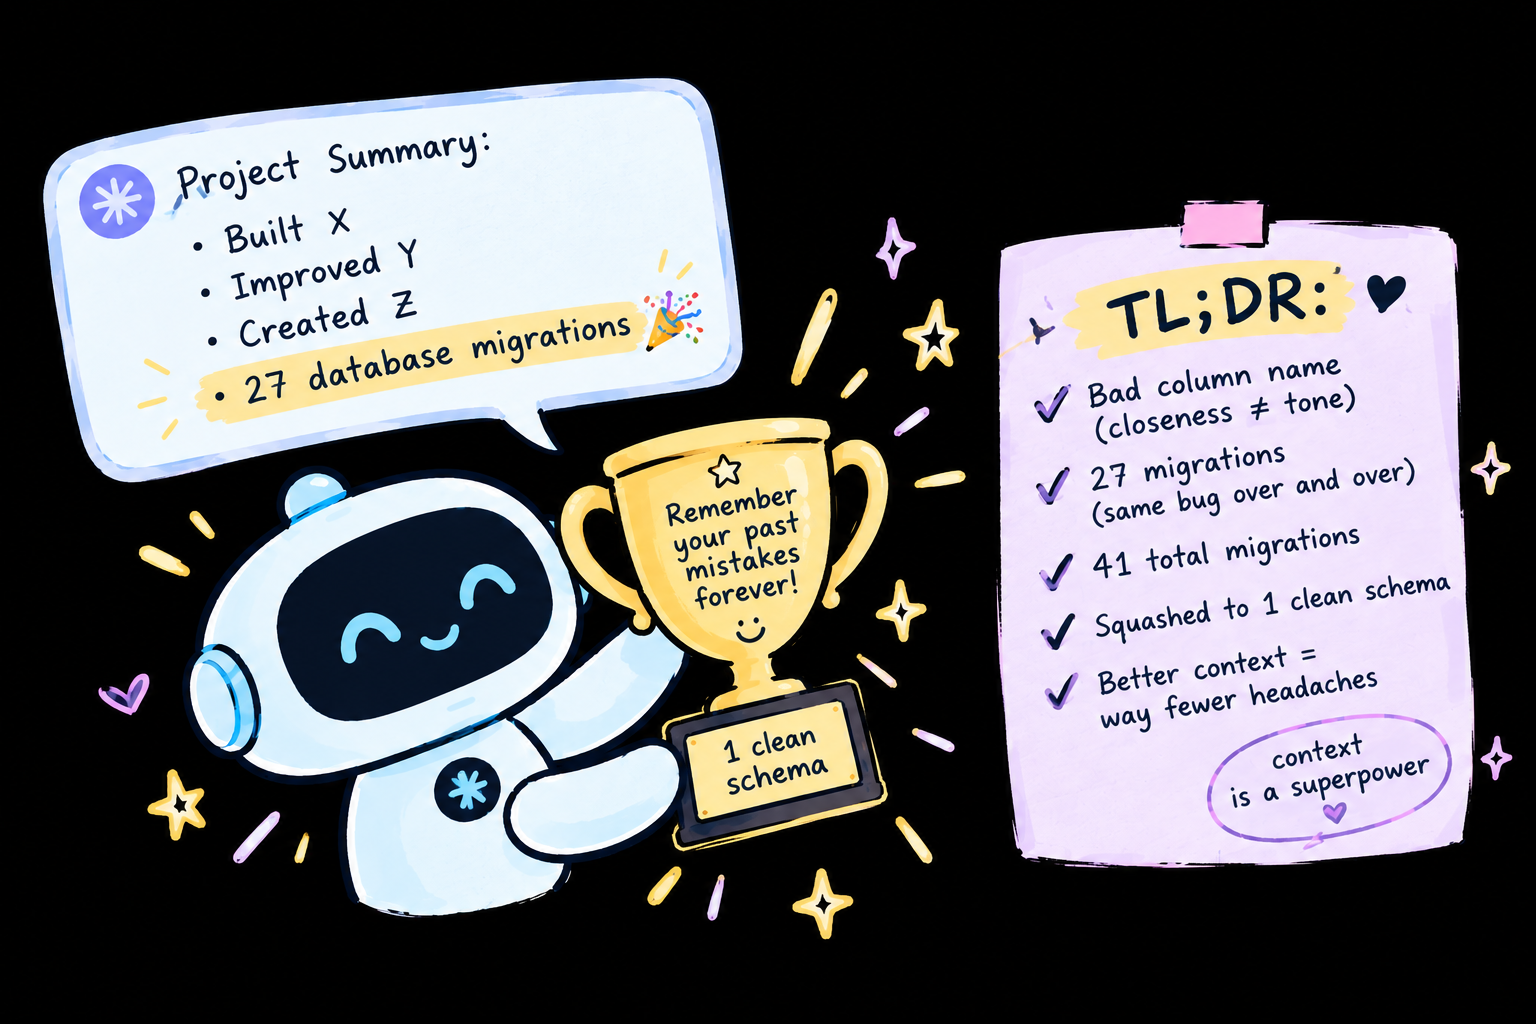
Early on, I had a database column whose name described closeness, while the value stored in it was connection tone. That is a bad name to begin with. The worse part was that each new code snippet trusted the name, so every attempted fix kept building on the same wrong assumption. Each attempt also meant another database migration.
I knew the naming mismatch was behind the behavior, but I needed a tool that could look at the whole project instead of just the next snippet. I gave Claude Code a sentence describing the mismatch. It found the problem, then asked a lot of questions to make sure the fix matched what I actually wanted. We got it sorted, and that was when the value of repository-wide context really clicked for me.
Later, I asked Claude to help summarize the project for an earlier version of this portfolio. It kept listing the 27 migrations as an accomplishment. Those migrations mostly came from the same bug being fixed, re-fixed, and re-fixed again because the earlier workflow kept losing the context. My portfolio was congratulating me for the exact thing I was trying to clean up.
There were 41 migrations across the project in total. I eventually squashed those into one clean schema. The 27 from that naming bug were not a feature. :)
Making Cytoscape look like this
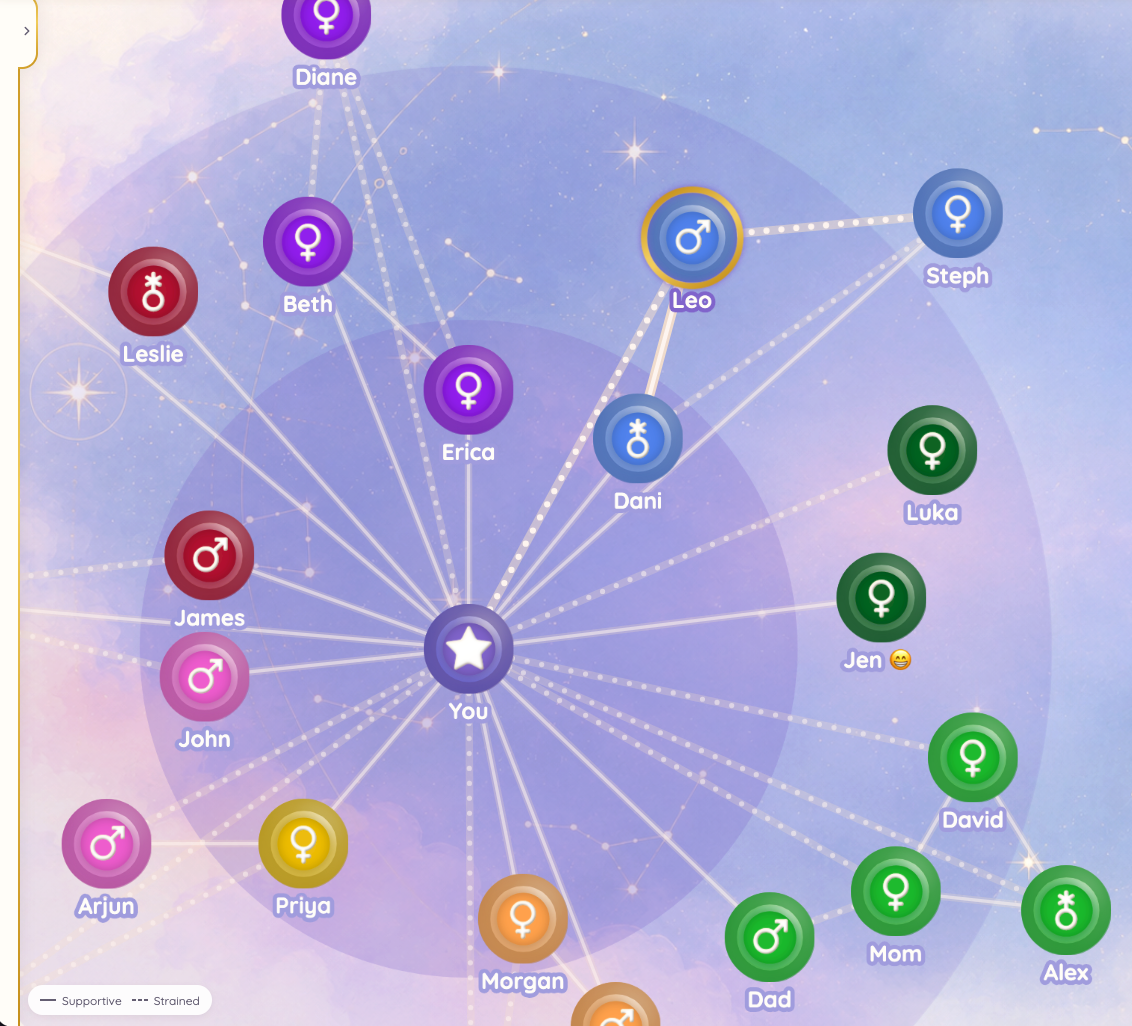
The graph uses Cytoscape.js for layout and interaction. It is good at handling graphs, but its canvas rendering means I could not style the nodes the way I would style ordinary HTML elements. CSS shadows and gradients were not going to get me the look I wanted.
I build each person node as an SVG in code, then Cytoscape renders it as an image. Each node has a cloudy texture, a colored disc with its own glow, a gold rim, and an icon with a stamped, beveled look. A few things took extra work:
- Blurry icons: the canvas was rasterizing SVGs at a built-in size and stretching them. I changed the rendering so each node image is drawn at the size it will actually use.
- SVG filter limits: each shape only gets one filter, so the glow and inner shadow had to be combined into single passes.
- Dimming a group: using transparency let connection lines show through the nodes. Dimmed nodes now use a muted solid color instead.
- Showing a selection: selecting someone briefly lights and pulses their connections, then settles down. The map communicates what changed without keeping everything animated.
Accessibility note: the graph is drawn on a canvas, so a screen reader cannot read the graph itself. The same people are available in an accessible list, although the spatial relationships in the map remain visual.
Privacy and access
The product is a personal reflection tool, not a clinical system. There is no therapist login, shared account, or invite-a-collaborator feature. Every piece of data belongs to one account, and the database enforces ownership at the data layer rather than relying on the interface to hide things.
If a user wants to share their map, they export a PDF and decide who receives it. A group, such as a practice, can sponsor access using a shared code. The person who buys those codes can see how many uses remain, but not who used them.
That distinction shaped both the account model and the billing flow. Paying for someone's access does not mean getting access to their relationships.
Under the hood
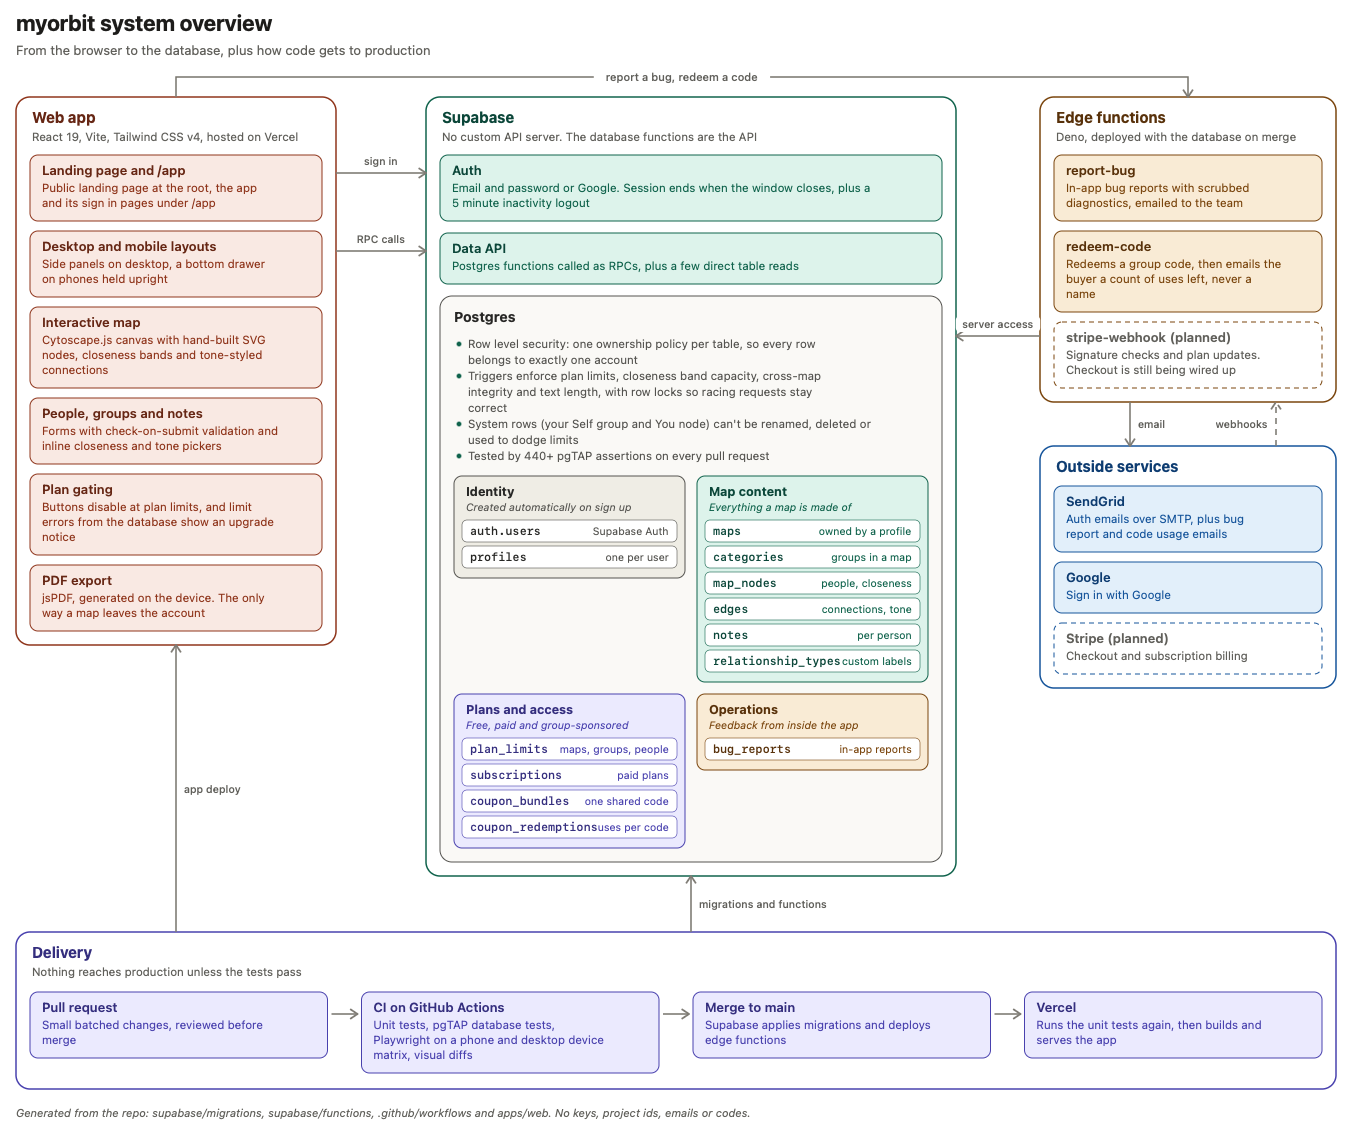
Stack: React 19, Vite, Tailwind CSS v4, Cytoscape.js, Supabase Postgres, auth and edge functions, jsPDF, SendGrid, Vercel, Vitest, Playwright, pgTAP, GitHub Actions, and Figma.
The database owns the important rules. Plan limits, account ownership, and data integrity are enforced in the data layer. They should still hold if a request comes from somewhere other than the expected UI, or if two requests happen at the same time.
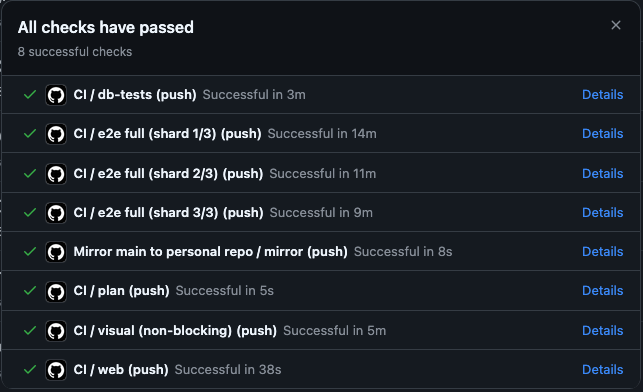
Three test suites run before deployment. There are more than 440 database test assertions, around 220 unit tests, and end-to-end layout checks across ten phone profiles and four desktop browsers. The database tests caught cross-account integrity bugs, which I fixed before outside users touched the app.
Known layout bugs stay visible. Open issues live in a registry with tests that are expected to fail. When a fix makes one of those tests pass, the suite flags it, so the registry does not quietly turn into a list of bugs nobody checks.
By the numbers
- 1 developer, working with a team of AI agents
- 326 commits and 60 merged pull requests
- 41 database migrations squashed into 1
- 440+ database test assertions and around 220 unit tests
- 14 phone and desktop browser profiles covered by end-to-end layout tests
What I would change next time
Start with the context. A lot of the early bugs came from agents filling in decisions I had not written down. I would set up the scaffold and record the decisions before the first implementation ticket.
Write the tests sooner. The database tests found problems almost as soon as I added them. They would have caught some of the early assumptions before those assumptions spread through the app.
Treat names as part of the design. A misleading column name made the same mistake easy to repeat. I am much more deliberate about naming now, especially when an agent is going to use that name as context.
Built for a client through Castle Logic LLC. The code is proprietary, so there is no public repository, but you can try the app at myorbit.network.
Gallery
The Live App
Figma Mockups
Development Process